
Похожее видео
×
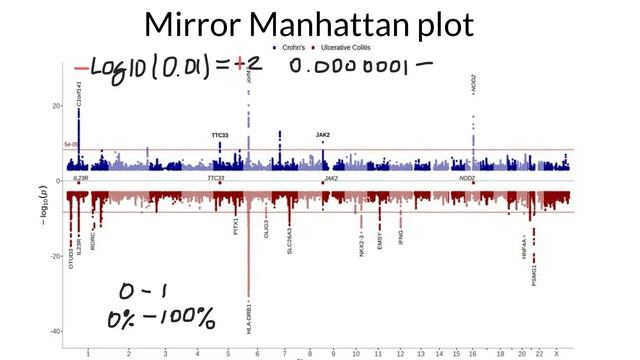
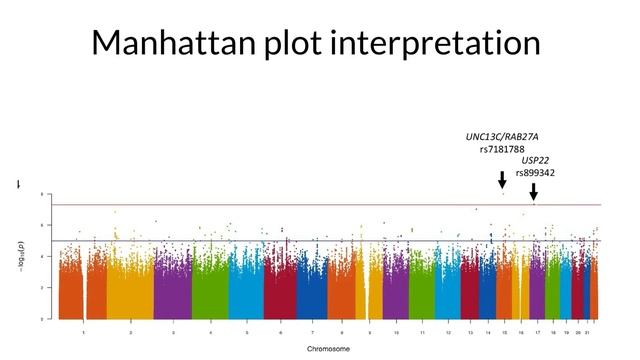
Mirror Manhattan plot Back-to-Back or Head-to-Head explained
Видео: Mirror Manhattan plot Back-to-Back or Head-to-Head explained
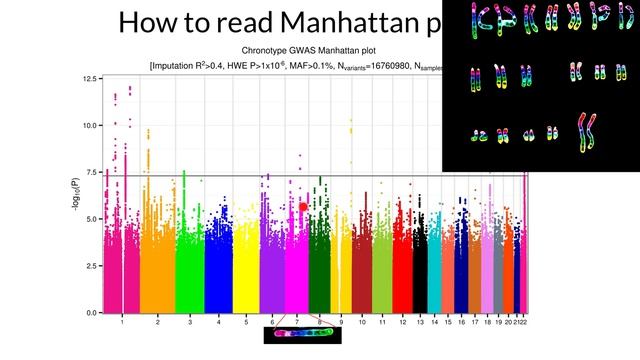
What is a Mirror Manhattan Plot? A Mirror Manhattan Plot also known as a Back-to-Back or Head-to-Head plot is a powerful visualization tool used in genetics to compare two different sets of GWAS Genome-Wide Association Study results in a single image. Instead of having two separate graphs one study is plotted normally upward and the other is flipped downward along the same horizontal axis the chromosomes. Why do we use them? The primary purpose is direct comparison. Here are the three main reasons why scientists use this format: 1. Colocalization Finding Shared Signals The most common use is to see if two different traits are controlled by the same genes. Example: If you plot Height on the top and Bone Density on the bottom and you see two peaks lining up perfectly at the same spot on Chromosome 12 it strongly suggests that the same genetic variation influences both traits. This is called pleiotropy. 2. Population Comparisons Scientists use mirror plots to see if a disease has the same genetic map in different ethnic groups. Example: Comparing a GWAS of Type 2 Diabetes in a European population top versus an African population bottom. If the skyscrapers align the risk factor is universal. If a peak only exists on the top that genetic risk is specific to that population. 3. Discovery vs. Replication When a scientist finds a new genetic link they must replicate it in a second independent group of people to prove it wasnt a fluke. Top: The original discovery study. Bottom: The replication study. If the bottom plot shows the same peaks as the top the discovery is confirmed as real. How to interpret the Negative Y-Axis? The Y-axis on the bottom is mathematically the same as the top log 10 P. The software simply multiplies the bottom values by -1 as a visual trick. Top Peaks: Higher means more significant. Bottom Peaks: Lower further from the center line means more significant. Summary for your Video: A Mirror Manhattan Plot is like a genetic spot the difference game. By flipping one study upside down we can instantly see if two different diseases or two different groups of people share the same genetic skyscrapers. If the peaks line up vertically weve found a shared biological mechanism. ,


2026-01-05 в 13:40:45

2026-04-20 в 16:17:06


2026-04-20 в 16:04:09

2026-04-20 в 17:13:58


2026-04-20 в 16:34:14

2025-06-24 в 13:09:46