Nikolay's Genetics Lessons - видео - все видео
Новые видео из канала RuTube на сегодня - 20 April 2026 г.
Новые видео из канала RuTube на сегодня - 20 April 2026 г.
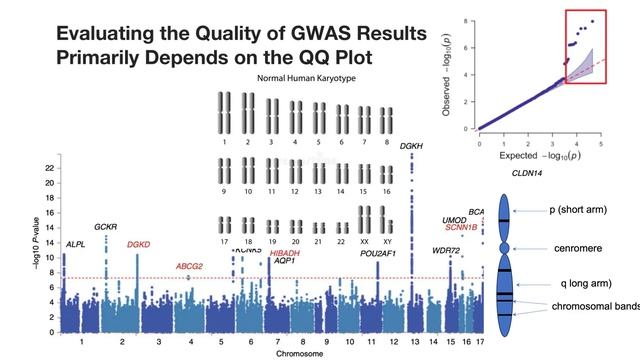
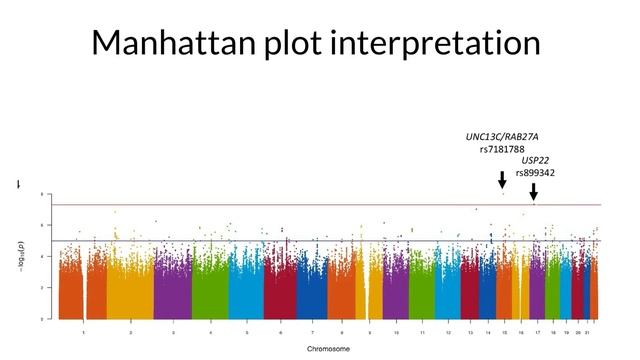
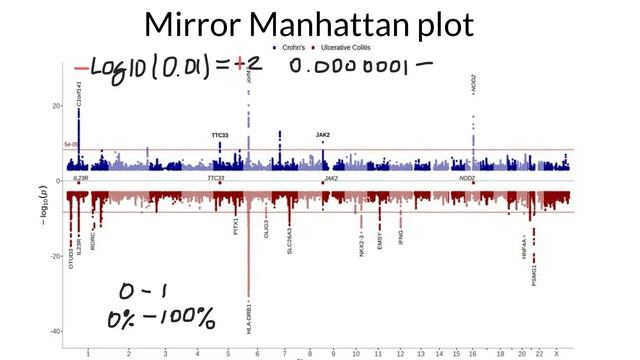
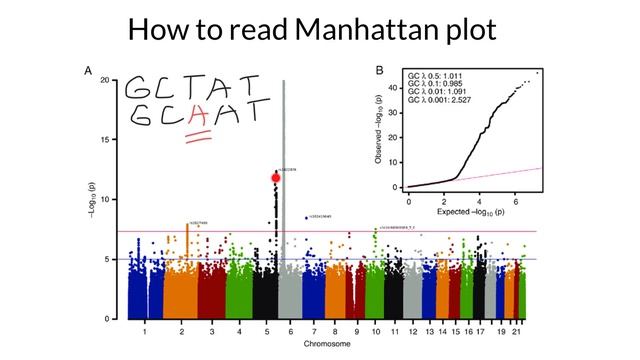
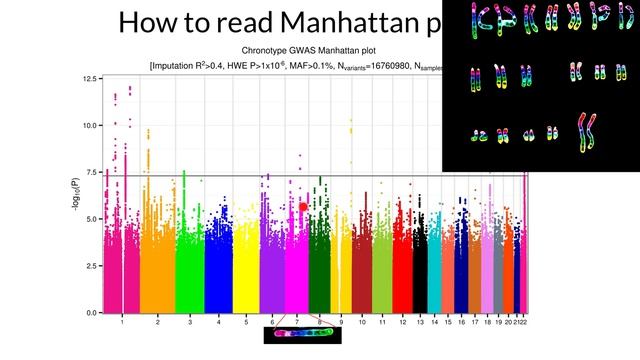
In genetics, the QQ Plot (Quantile-Quantile plot) is the "quality control" partner to your Manhattan plot. It tells you if your statistical model is working or if your data is "noisy." Looking at the QQ plot in your image (the small plot in the top right corner), here is how to interpret it for your viewers: 1. The Red Diagonal Line (The Expected) The red line represents the Null Hypothesis. It shows what the data would look like if there were zero genetic associations—essentially, if everything was just random chance. If all your black dots stayed on this red line, your study found nothing. 2. The Black Dots (The Observed) These are your actual results. You want to see them follow the red line for most of the way and then "break away" at the very end. The "Tail" (Upper Right): Notice how the dots at the far right of your image curve sharply upward away from the red line. Interpretation: This is exactly what you want to see! This "tail" represents the true genetic signals (the skyscrapers on your Manhattan plot). It means these SNPs are much more significant than what would happen by random chance. 3. Diagnosing Problems (The Shape) The shape of this curve tells a story about your data quality: Early Inflation (Bulging upward early): If the black dots lift off the red line right from the start (near the bottom left), it usually means Population Stratification. In plain English: It means your results are biased because of the ethnic makeup of your groups or cryptic relatedness (e.g., you accidentally included a bunch of cousins), rather than actual biology. Deflation (Sagging below the line): If the dots stay below the red line, your model is too strict. You are "killing" your signals, and you might miss real discoveries (False Negatives). The "Perfect" Plot (Like yours): Most dots stay on the line, and only the most significant ones curve up at the end. This suggests a clean study with real hits. https://www.youtube.com/watch?v=HimTorACbsEIn the modern system, the same physical position should not have different rs numbers for different mutations. Instead, all possible variations at that specific coordinate are grouped under a single rs ID. Here is how the system handles the "3 possible mutations" at every spot: 1. The "One ID, Multiple Alleles" Rule Even though a single position in the DNA (e.g., Cytosine) can mutate into three other things (Adenine, Guanine, or Thymine), the dbSNP database assigns one rs number to that specific "locus" (location). In the database entry for that rs ID, you will see a list of Alleles. For example: Position: Chromosome 1, 123456 ID: rs100 Alleles: C/A/G/T (This means the "Reference" is C, but they have found people with A, G, and T at this exact same spot). 2. Multi-Allelic SNPs When more than two variations exist at one spot, scientists call it a Multi-allelic SNP. Most SNPs are bi-allelic (only two versions exist in the population, like A or G). Some are tri-allelic or quad-allelic. Even if it is quad-allelic (all 4 bases are found there), it still keeps the same rs number to avoid confusion. 3. Why it was confusing in the past (Legacy Data) In the early days of genetics, different labs discovered different mutations at the same spot and gave them different names. This created "duplicate" rs numbers for the same location. However, the NCBI (which manages these IDs) performs "merges." If they find two rs IDs pointing to the same coordinate, they retire one and merge it into the other. This is why you will sometimes see a note saying "rs123 has been merged into rs456." 4. How this looks on your Manhattan Plot When you see a peak on your graph labeled rs12345, that peak represents the association of that location with the trait. It doesn't tell you which mutation (A, G, or T) is the "risk" version. To find that out, you have to look at the Summary Statistics table, which will list the Effect Allele (the specific letter that causes the change). https://www.youtube.com/watch?v=PFdRuCYJ4TAWhat is a Mirror Manhattan Plot? A Mirror Manhattan Plot (also known as a "Back-to-Back" or "Head-to-Head" plot) is a powerful visualization tool used in genetics to compare two different sets of GWAS (Genome-Wide Association Study) results in a single image. Instead of having two separate graphs, one study is plotted normally (upward) and the other is flipped (downward) along the same horizontal axis (the chromosomes). Why do we use them? The primary purpose is direct comparison. Here are the three main reasons why scientists use this format: 1. Colocalization (Finding Shared Signals) The most common use is to see if two different traits are controlled by the same genes. Example: If you plot "Height" on the top and "Bone Density" on the bottom, and you see two peaks lining up perfectly at the same spot on Chromosome 12, it strongly suggests that the same genetic variation influences both traits. This is called pleiotropy. 2. Population Comparisons Scientists use mirror plots to see if a disease has the same genetic "map" in different ethnic groups. Example: Comparing a GWAS of Type 2 Diabetes in a European population (top) versus an African population (bottom). If the "skyscrapers" align, the risk factor is universal. If a peak only exists on the top, that genetic risk is specific to that population. 3. Discovery vs. Replication When a scientist finds a new genetic link, they must "replicate" it in a second, independent group of people to prove it wasn't a fluke. Top: The original discovery study. Bottom: The replication study. If the bottom plot shows the same peaks as the top, the discovery is confirmed as "real." How to interpret the "Negative" Y-Axis? The Y-axis on the bottom is mathematically the same as the top (−log 10 P). The software simply multiplies the bottom values by -1 as a visual trick. Top Peaks: Higher means more significant. Bottom Peaks: Lower (further from the center line) means more significant. Summary for your Video: "A Mirror Manhattan Plot is like a genetic 'spot the difference' game. By flipping one study upside down, we can instantly see if two different diseases or two different groups of people share the same genetic 'skyscrapers.' If the peaks line up vertically, we've found a shared biological mechanism." https://www.youtube.com/watch?v=GAtMHqfsuM0To understand how genetically different people are at the SNP level, we have to look at two different numbers: the total DNA sequence and the specific variation sites (SNPs). Here is the breakdown of the percentages: 1. The "99.9%" Rule (Total DNA) If you compare the entire 3 billion letters of your DNA to any other human on Earth, you are 99.9% identical. Only about 0.1% of the genome varies between individuals. While 0.1% sounds tiny, our genome is so massive that this 0.1% accounts for roughly 3 million differences (mostly SNPs) between you and a stranger. 2. SNP Variation (The "4 to 5 Million" Rule) When scientists look specifically at SNPs (Single Nucleotide Polymorphisms), they find that a typical individual carries between 4 million and 5 million SNPs that differ from the "standard" reference human genome. Common SNPs: Most of these (about 90%) are common variations found in many populations. Rare SNPs: A small percentage are unique to you or your immediate family. 3. Why the Manhattan Plot looks so "Busy" In the picture you shared, the X-axis isn't showing every single bit of DNA. It only plots the SNPs that scientists chose to test (often 500,000 to 1 million specific spots). Even though humans are 99.9% the same, those millions of tiny SNP differences are what determine: Your height. Your risk for certain diseases. How your muscles respond to training (relevant for your kinesiology studies!). https://www.youtube.com/watch?v=7k1tKpf-WIoThat "gap" or "dip" in the middle of Chromosome 1 (and other chromosomes on the plot) is exactly where the Centromere is located. Here is the breakdown of why it looks that way on a Manhattan Plot: 1. The Centromere is "Gene-Poor" The centromere is made of highly repetitive DNA sequences (satellite DNA). Unlike the "arms" of the chromosome, it contains very few actual genes. Since Manhattan Plots track SNPs (Single Nucleotide Polymorphisms) to find gene-disease links, there are simply fewer variants to measure in that specific region. 2. Difficulty in Sequencing Because the centromere is so repetitive, it is incredibly difficult for standard sequencing machines to "read" and map correctly. Imagine trying to assemble a puzzle where 1,000 pieces are exactly the same shade of blue—that is what the centromere is like for a computer. Most researchers filter out these regions because the data there is often unreliable or "noisy." 3. Biological "Silent Zones" In Genetic Association studies (GWAS), we look for areas where DNA varies. The centromere is a structural anchor used for cell division (attaching to spindle fibers). Evolution keeps these areas very stable, so you don't see the same kind of "skyscraper" peaks of variation that you see in the gene-rich arms. 4. Physical Gap in the Reference Genome In older versions of the human reference genome (like hg19), these centromeric regions were often represented as "N" (unknown bases) or large gaps because we couldn't bridge the repetitive sequences yet. This creates a literal physical empty space on the X-axis of your graph. Would you like me to explain why some chromosomes (like 13, 14, and 15) have even larger gaps at the very beginning of their plots? https://www.youtube.com/watch?v=OezG73EN_kgSetting a micropipettor involves adjusting it to dispense or aspirate a specific volume of liquid accurately. Micropipettors are commonly used in laboratories for precise liquid handling. Here are the general steps for setting a micropipettor: Select the Appropriate Pipette: Choose the micropipettor that is calibrated for the volume you need to pipette. Micropipettors come in various volume ranges, such as 0.1-2.0 µL, 2-20 µL, 20-200 µL, and so on. Adjust the Volume Setting: Most micropipettors have a volume adjustment mechanism, which typically consists of a volume setting dial or plunger. Turn the volume setting dial or adjust the plunger to the desired volume. Make sure to set it precisely to the required volume; some micropipettors have two adjustment points, one for coarse and one for fine adjustments. Calibrate the Micropipettor: Before use, it's a good practice to calibrate the micropipettor to ensure its accuracy. This involves checking that the micropipettor dispenses the intended volume accurately. Use a calibrated balance or a designated calibration device to do this. Follow your laboratory's standard operating procedures for calibration. Pre-Wet the Tip: Attach a disposable pipette tip to the micropipettor. Before aspirating your sample, pre-wet the tip by dispensing and discarding the liquid a few times. This ensures that the tip is filled with the liquid you're pipetting and reduces the risk of sample loss. Aspirate the Sample: Place the tip of the micropipettor into your liquid sample. Depress the plunger to the first stop (usually a soft stop). This will allow the micropipettor to aspirate the liquid into the tip. Dispense the Sample: Move the micropipettor to the destination container and gently depress the plunger to the second stop (usually a hard stop) to dispense the liquid. Make sure the tip is fully submerged in the receiving container to prevent sample loss. Eject the Tip: After dispensing the sample, eject the disposable tip into a designated container for used tips. Most micropipettors have an ejection mechanism to remove the tip without touching it. Check and Record: Always double-check the volume setting on the micropipettor to ensure it matches the intended volume. Record the volume dispensed for accurate documentation. Store Properly: After use, return the micropipettor to its storage position, ensuring it is kept in good working condition. Routine Maintenance: Regularly clean and maintain your micropipettor according to the manufacturer's recommendations to ensure accuracy and longevity. Remember that the specific procedures may vary depending on the brand and model of the micropipettor, so it's essential to refer to the manufacturer's instructions and your laboratory's protocols for precise guidance on setting and using your micropipettor. https://www.youtube.com/watch?v=I9eax-a5QDgSetting a micropipettor involves adjusting it to dispense or aspirate a specific volume of liquid accurately. Micropipettors are commonly used in laboratories for precise liquid handling. Here are the general steps for setting a micropipettor: Select the Appropriate Pipette: Choose the micropipettor that is calibrated for the volume you need to pipette. Micropipettors come in various volume ranges, such as 0.1-2.0 µL, 2-20 µL, 20-200 µL, and so on. Adjust the Volume Setting: Most micropipettors have a volume adjustment mechanism, which typically consists of a volume setting dial or plunger. Turn the volume setting dial or adjust the plunger to the desired volume. Make sure to set it precisely to the required volume; some micropipettors have two adjustment points, one for coarse and one for fine adjustments. Calibrate the Micropipettor: Before use, it's a good practice to calibrate the micropipettor to ensure its accuracy. This involves checking that the micropipettor dispenses the intended volume accurately. Use a calibrated balance or a designated calibration device to do this. Follow your laboratory's standard operating procedures for calibration. Pre-Wet the Tip: Attach a disposable pipette tip to the micropipettor. Before aspirating your sample, pre-wet the tip by dispensing and discarding the liquid a few times. This ensures that the tip is filled with the liquid you're pipetting and reduces the risk of sample loss. Aspirate the Sample: Place the tip of the micropipettor into your liquid sample. Depress the plunger to the first stop (usually a soft stop). This will allow the micropipettor to aspirate the liquid into the tip. Dispense the Sample: Move the micropipettor to the destination container and gently depress the plunger to the second stop (usually a hard stop) to dispense the liquid. Make sure the tip is fully submerged in the receiving container to prevent sample loss. Eject the Tip: After dispensing the sample, eject the disposable tip into a designated container for used tips. Most micropipettors have an ejection mechanism to remove the tip without touching it. Check and Record: Always double-check the volume setting on the micropipettor to ensure it matches the intended volume. Record the volume dispensed for accurate documentation. Store Properly: After use, return the micropipettor to its storage position, ensuring it is kept in good working condition. Routine Maintenance: Regularly clean and maintain your micropipettor according to the manufacturer's recommendations to ensure accuracy and longevity. Remember that the specific procedures may vary depending on the brand and model of the micropipettor, so it's essential to refer to the manufacturer's instructions and your laboratory's protocols for precise guidance on setting and using your micropipettor. https://www.youtube.com/watch?v=dxMRH2T3GbYTo solve this problem, we use a two-set Venn diagram where Circle A represents the A antigen and Circle B represents the B antigen. Step-by-Step Solution: 1. Fill in the Intersection (The overlap): Always start with the students who have both. n(A∩B)=7 (Type AB) 2. Calculate "Only A" (Type A): We know 42 students total have the A antigen, but this includes the 7 who also have B. n(Only A)=n(A)−n(A∩B) 42−7=35 3. Calculate "Only B" (Type B): We know 18 students total have the B antigen. n(Only B)=n(B)−n(A∩B) 18−7=11 4. Calculate the Union (Everyone with at least one antigen): Add the unique parts together: 35(Only A)+11(Only B)+7(Both)=53 5. Calculate "Neither" (Type O): Subtract the Union from the total population (100). 100−53=47 Final Answers: How many have only the A antigen? 35 students. How many have neither antigen (Type O)? 47 students. https://www.youtube.com/watch?v=YiVmwwk1RBMBiostatistics is a vital field that sits at the crossroads of biology, statistics, and health. It involves the application of statistical techniques to scientific research in health-related fields, including medicine, biology, and public health. Biostatisticians play a crucial role in designing biological experiments, especially in the field of medicine, analyzing data from these experiments, and interpreting the results. A Venn diagram, named after John Venn, is a simple but powerful tool used in the field of statistics and data science for showcasing the relationships between different sets of data. It consists of multiple overlapping circles, each representing a set of items or values. The areas where the circles overlap indicate the common elements between the sets. In the realm of biostatistics, Venn diagrams can be particularly useful. They offer a straightforward visual representation of the relationships between different biological variables or conditions. For example, consider a study on the risk factors for a certain disease. Each circle in a Venn diagram could represent a different risk factor, such as genetics, lifestyle, or environmental exposure. The overlap between these circles could indicate individuals who possess multiple risk factors, helping researchers to understand the complex interactions that contribute to the disease. Moreover, Venn diagrams are beneficial in genomic studies. When researchers look at gene expression under various conditions, Venn diagrams can visually depict which genes are active (or expressed) under each condition. This overlap can lead to insights about which genes are crucial in multiple conditions, guiding further research and potentially leading to breakthroughs in understanding diseases at a genetic level. In clinical trials, Venn diagrams can be used to illustrate the overlap in symptoms, side effects, or efficacy of different treatments. This visual representation helps in making complex data more understandable and aids in decision-making processes. The simplicity of Venn diagrams makes them an excellent tool for communicating complex biostatistical concepts to a broader audience, including those without a statistical background. Whether it's for academic research, pharmaceutical development, or public health policy, Venn diagrams serve as a bridge, bringing clarity and insight to the intricate world of biostatistics. https://www.youtube.com/watch?v=yquWwaYVKwgPotential Reasons for Observations in Well 8 (Fewer Cuts, Larger Bands): Given that all samples were treated under the same conditions (same EcoRV enzyme, buffer, 37°C for 2 hours), the observation in well 8 suggests that the DNA in that sample was less efficiently cut by EcoRV compared to other wells that show more complete digestion (e.g., well 5 or 6, which seem to have more distinct, smaller bands). Here are possible reasons: Insufficient DNA Concentration for Enzyme Activity (less likely but possible): If the DNA concentration in well 8 was significantly higher than the enzyme's capacity to cut all recognition sites within the two-hour incubation, it could lead to incomplete digestion. However, if other wells with similar DNA input show more complete digestion, this becomes less probable as the primary reason. Presence of Inhibitors: Well 8 might contain an inhibitor that interfered with EcoRV's activity. Common inhibitors include: Residual salts or chemicals from DNA extraction: Ethanol, phenol, or guanidinium salts left over from DNA purification can inhibit enzyme activity. Contaminating proteins: Some proteins can bind to DNA or the enzyme, hindering the cutting process. EDTA: While often used to protect DNA, high concentrations of EDTA can chelate magnesium ions, which are essential cofactors for EcoRV. DNA Quality Issues: Damaged or degraded DNA: If the DNA in well 8 was partially degraded or had nicks prior to digestion, the enzyme might not be able to effectively bind and cut at all sites, leading to larger, smudged bands. DNA conformation: While EcoRV cuts double-stranded DNA, unusual DNA conformations could potentially hinder efficient cutting. This is less common but theoretically possible. Possible Explanations for Well 9 Showing More DNA Bands than the Rest (More Cuts than Well 8): Well 9 showing "more DNA bands" typically indicates more complete digestion into smaller fragments. If it truly has more distinct bands rather than just smaller, more numerous fragments from complete digestion, it could imply: More Complete Digestion: Compared to well 8, well 9 appears to have undergone more complete digestion, resulting in smaller fragments migrating further down the gel and appearing as more distinct bands. This is the most straightforward interpretation if the original DNA in well 9 was similar to other samples. Higher Concentration of Target DNA/More Recognition Sites (less likely without prior knowledge): If the initial amount of DNA in well 9 was significantly higher, and it was still effectively digested, you might see more intense bands. However, "more bands" usually refers to the number of different sized fragments, not just intensity. Presence of Multiple DNA Species: This is a significant possibility. If the DNA in well 9 was a mixture of different DNA molecules (e.g., different plasmids, or genomic DNA with highly variable recognition sites that resulted in many different-sized fragments upon digestion), it would lead to a greater number of bands. Why Well 9 Shows More Cuts than Well 8, if Both Samples Were Processed in the Same Way: Given the premise that both were processed identically (same enzyme, buffer, temperature, time), the differences must stem from inherent differences in the DNA sample itself or subtle, unobserved variations in handling: Inhibitors in Well 8 vs. Absence in Well 9: The most probable and common explanation is that well 8 contained an inhibitor that significantly reduced EcoRV's activity, leading to incomplete digestion (fewer cuts, larger bands), while well 9 was free of such inhibitors, allowing EcoRV to cut efficiently and completely (more cuts, smaller, more numerous bands). This aligns perfectly with the observed phenotype. DNA Quality/Purity Differences: Well 8 DNA was less pure: Contaminants (salts, proteins) in well 8 actively inhibited the enzyme. Well 9 DNA was purer: The DNA in well 9 was clean and free of inhibitors, allowing for optimal enzyme ... https://www.youtube.com/watch?v=Gxdz3m6V27EThe canonical conformation of the DNA molecule is a double helix which under physiological conditions forms a stable structure known as B DNA. However, certain environments and sequence motifs favor other DNA conformations, known as non-canonical secondary structures. Moreover, many of the structures are also present in RNA molecules. These structures include perfect and imperfect hairpins, cruciforms, slipped structures, R-loops, G-quadruplexes, i-motifs, Z-DNA, Z-RNA, triple-stranded DNA, RNA and hybrid structures. Sequences that are predisposed to secondary structure formation are enriched at regulatory regions, including open chromatin regions, promoters, 5’UTRs and 3’UTRs [1, 2] (Fig. 1). In particular, they are over-represented and positioned relative to key gene features, such as transcription start and transcription end sites, splice junctions and translation initiation regions, while their formation is associated with transcriptionally active loci [4,5,6,7,8,9,10,11]. Thus, secondary structures can have a functional impact since promoter regions control transcription initiation, while 3’UTRs have a number of functions, including impacting the stability of the transcript and its rate of degradation, providing binding sites for regulatory elements such as miRNAs and RNA binding proteins (RBPs), and containing signals for the localisation of the transcript in the cell. Schematics of DNA and RNA structures. A The canonical right handed double helix, also known as B DNA secondary structure. B Z-DNA forms a left-handed double helix. C G-quadruplexes are formed by the stacking of multiple G-quartets held together by Hoogsteen hydrogen bonds (top). Four guanines establish hydrogen bonds with each other to form a G-quartet (bottom). Hoogsteen hydrogen bonds are highlighted in blue. The monovalent cation that can stabilize the G-quadruplex structure is marked with M. D Hairpins are formed at inverted repeats, in which the stem base pairs hybridize with hydrogen bonds, while the loop remains single-stranded. E Slipped-strand mispairing at tandem repeats results in slipped structure formation. F Depiction of a homopurine-homopyrimidine sequence with mirror symmetry. H-DNA is a triple helix secondary structure where the third strand hybridizes with Hoogsteen hydrogen bonds with the duplex DNA, while the fourth strand remains single stranded. G R-loops are formed co-transcriptionally at the template strand. The nascent RNA produced by the RNA-polymerase hybridizes with the template strand to form an R-loop structure, while the non-template strand remains single-stranded https://www.youtube.com/watch?v=Bk1u6Zq6MvsPrimer dimers are a common byproduct in PCR (Polymerase Chain Reaction) experiments that can interfere with desired amplification and downstream analysis. They form when two primers in the reaction hybridize to each other due to complementary sequences, and the DNA polymerase then extends this hybridized structure, creating a small, unintended DNA fragment. Here's what primer dimer contamination typically looks like, especially when visualized on an agarose gel: Small, Fast-Migrating Band: Primer dimers are usually very short DNA fragments, typically ranging from 20 to 60 base pairs (bp) in length. Because DNA migrates through an agarose gel inversely proportional to its size (smaller fragments move faster and further), primer dimers will appear as a bright band located very low down on the gel, close to the bottom (anode) end. This is often below the smallest bands of your DNA ladder (e.g., below the 100 bp mark). Presence in Negative Controls: A key indicator of primer dimer formation is their presence in the no-template control (NTC) lane. The NTC contains all PCR reagents (including primers) but no template DNA. Since primer dimers form from primer-primer interactions, they will still be amplified even without template, thus appearing in the NTC lane. If you see a band in your NTC at the size characteristic of primer dimers, it strongly suggests their presence in your other samples. Intensity and Potential Smearing: Primer dimer bands can range from faint to very bright and intense. A very bright primer dimer band often indicates significant competition for PCR reagents (primers and dNTPs), which can reduce the yield of your desired PCR product. While often appearing as a discrete band, severe primer dimer formation can sometimes lead to a faint smear in the low molecular weight region, especially if multiple slightly different dimer products are formed. Melting Curve Analysis (qPCR): In quantitative PCR (qPCR) using intercalating dyes (like SYBR Green), primer dimers can be identified by their melting curve. Since primer dimers are short, they will denature (melt) at a lower temperature (lower Tm) compared to the specific, longer PCR product. This will appear as a distinct peak at a lower temperature on the dissociation curve. https://www.youtube.com/watch?v=Nsf_exeu-SAThere are several potential reasons why some of your protein samples fail to resolve properly in SDS-PAGE despite being prepared using the same protocol. First, protein aggregation or incomplete denaturation could be responsible—this may occur due to inadequate boiling, presence of disulfide bonds not fully reduced (ensure sufficient β-mercaptoethanol or DTT), or high protein concentration leading to precipitation upon heating. Second, residual salts, detergents, or other contaminants (e.g., from lysis buffers, protease inhibitors, or incomplete clarification) may interfere with electrophoresis; consider buffer exchange or protein cleanup before loading. Third, proteolysis or sample degradation may lead to smearing—ensure immediate sample processing or inclusion of protease inhibitors and keep samples on ice. Fourth, incomplete solubilization of the pellet or uneven sample mixing may result in inconsistent loading. Finally, differences in cell lysis efficiency or localized concentration differences within lysates could explain why some samples resolve poorly while others do not; vortex thoroughly and clarify lysates by centrifugation. Running a small aliquot on a test gel or using a BCA/Bradford assay to normalize protein concentration prior to loading may help. https://www.youtube.com/watch?v=Abc9FA6p50MGC-Clamps in PCR Primer Design refer to regions rich in guanine (G) and cytosine (C) nucleotides near the 3' end of a PCR primer. GC-Clamps are intentionally included to enhance the primer's binding stability to the target DNA sequence. Why GC? G-C base pairs form three hydrogen bonds, compared to two in A-T base pairs, making G-C interactions more stable under high-temperature conditions, such as during the annealing phase of PCR. Position: GC-Clamps are typically designed at the 3' end of the primer to ensure that the primer remains tightly bound to the template during the elongation phase of PCR. Optimal Number: Typically, primers are designed to include 1–3 G or C bases within the last five nucleotides at the 3' end. Too many GC bases can lead to secondary structures or primer-dimer formation. Functionality: Improves primer-template annealing efficiency. Reduces the likelihood of premature detachment during DNA polymerase extension. Design Guidelines: Avoid a GC content exceeding 60% across the primer length to prevent non-specific bindings. Avoid long runs of G or C bases that can lead to primer-dimer artifacts. Practical Importance: Including GC-Clamps in primer design is a common strategy to ensure robust and specific amplification in PCR experiments, especially for challenging templates or under stringent reaction conditions. https://www.youtube.com/watch?v=UgdnzkiM5ysA dot plot matrix, also known as a similarity matrix, is a two-dimensional graph that visually compares two sequences of DNA or protein. It's one of the oldest methods for comparing sequences: How it works Each sequence is represented by an axis on the plot. A dot is placed in the matrix where a fixed-size window on one sequence matches the other sequence. What it shows A diagonal line of dots indicates that two sequences are identical or very similar. What it can be used for Dot plots can also be used to identify regions of low complexity, direct or inverted repeats, and other features. How to interpret Cells in the matrix can be shaded to make matching segments more visible. How to improve Smoothing algorithms can reduce background noise, and substitution matrices can account for evolutionary distance. Here are some things to keep in mind about dot plots: They can be noisy, especially for longer sequences. They don't return a score to indicate how optimal an alignment is. Most dot matrix computer programs don't show an actual alignment. https://www.youtube.com/watch?v=PyjKLqui75gA dot plot matrix, also known as a similarity matrix, is a two-dimensional graph that visually compares two sequences of DNA or protein. It's one of the oldest methods for comparing sequences: How it works Each sequence is represented by an axis on the plot. A dot is placed in the matrix where a fixed-size window on one sequence matches the other sequence. What it shows A diagonal line of dots indicates that two sequences are identical or very similar. What it can be used for Dot plots can also be used to identify regions of low complexity, direct or inverted repeats, and other features. How to interpret Cells in the matrix can be shaded to make matching segments more visible. How to improve Smoothing algorithms can reduce background noise, and substitution matrices can account for evolutionary distance. Here are some things to keep in mind about dot plots: They can be noisy, especially for longer sequences. They don't return a score to indicate how optimal an alignment is. Most dot matrix computer programs don't show an actual alignment. https://www.youtube.com/watch?v=gm4LfS1egQIGlobal Alignment Goal: To align the entire length of two sequences, maximizing similarity across the entire length. Suitable for: Comparing closely related sequences of similar length. Identifying overall similarity and evolutionary relationships. Example: Aligning two full-length protein sequences to assess their overall evolutionary divergence. Local Alignment Goal: To identify regions of high similarity within the sequences, regardless of their position within the overall sequence. Suitable for: Finding short conserved regions or motifs within longer sequences. Identifying conserved domains in proteins. Detecting distant evolutionary relationships where only small regions might be conserved. Example: Finding a short conserved DNA motif within a large genomic sequence. Key Differences Scope: Global aligns the entire length, while local focuses on regions of highest similarity. Gap Penalties: Global alignment often treats gaps equally throughout. Local alignment may penalize gaps more heavily near the ends of the alignment. Applications: Global alignment is better for closely related sequences, while local alignment is more suitable for detecting short conserved regions or distant relationships. Algorithms Global: Needleman-Wunsch algorithm Local: Smith-Waterman algorithm 1 https://www.youtube.com/watch?v=99mpiXe1TvQCauses of Smearing in Gel Electrophoresis Smearing during gel electrophoresis can obscure results and make DNA analysis challenging. Smears occur when DNA bands are not well-defined, and the causes can be grouped into several categories: Sample Issues Degraded DNA: DNA that has been improperly stored or handled may break into smaller fragments, leading to diffuse or smeared bands. Overloaded Wells: Excess DNA in a well can cause bands to blur into smears due to uneven migration. Gel Preparation Low-Agarose Concentration: Gels with insufficient agarose concentration may fail to resolve DNA fragments properly. Uneven Gel Casting: If the gel is uneven or contains bubbles, it can distort the migration pattern. Buffer Problems Old or Contaminated Buffer: Using buffer that is degraded or reused too many times can lead to uneven ion gradients and smearing. Improper Buffer Concentration: Buffers that are too diluted or too concentrated can affect DNA migration and band clarity. Electrophoresis Conditions High Voltage: Excessive voltage causes DNA to migrate too quickly, generating heat that can melt the gel slightly and cause smears. Prolonged Run Time: Running the gel for too long can lead to DNA diffusing out of the bands. Staining and Visualization Uneven Staining: Unequal application of staining dye or improper destaining can make bands appear smeared. Excess Dye: Overuse of intercalating dyes like ethidium bromide can create smears during visualization under UV light. Solutions to Prevent Smearing Use high-quality, intact DNA and avoid overloading the wells. Ensure proper gel preparation with the correct agarose concentration and no bubbles. Use fresh, correctly prepared buffer. Run the gel at appropriate voltage and time settings. Apply staining dyes evenly and follow proper visualization protocols. https://www.youtube.com/watch?v=4cEjGGVZ3yIAdjusting the volume of the pipette is the trickiest part of the micropipetting process. A simple mistake could lead to a large error in the preparation of your experiment. You will need to refer to the volume knob and number windows to accurately input the volume you are going to pipet. To adjust the volume, first refer to the number window. If the volume is lower than the volume you need to pipet, turn the volume knob clockwise to increase the volume until the desired volume is read in the number window. To decrease the volume, the volume knob should be turned counterclockwise. The following table describes how to read the number window for each pipette: https://www.youtube.com/watch?v=LJwRGWjVjV0Here are a few steps to troubleshoot a smeared DNA ladder in gel electrophoresis: Check Gel Concentration – Ensure the agarose gel concentration is appropriate for the DNA fragment sizes you're analyzing; for larger fragments, use a lower concentration (e.g., 0.8%), and for smaller fragments, a higher concentration (e.g., 1.5–2%). Reduce Sample Overload – Too much DNA in the ladder or sample can cause smearing. Use the recommended amount for your ladder and samples. Optimize Gel Running Voltage – Running the gel at a high voltage can cause smearing. Try reducing the voltage to around 5–8 V/cm of gel length for cleaner bands. Use Fresh Buffer – Old or depleted electrophoresis buffer can affect DNA migration and resolution. Prepare fresh buffer before running your gel. Ensure Complete Digestion – If the DNA ladder includes restriction digests, confirm that all samples are fully digested to avoid partial fragments that can appear as smears. Check DNA Quality – Degraded DNA can smear on the gel. Ensure DNA samples and ladder are high-quality and properly stored. Avoid Ethidium Bromide Overloading – Excessive ethidium bromide can lead to smearing. Use the recommended concentration if adding it directly to the gel or staining after electrophoresis. Optimize Gel Casting and Loading – Ensure the gel is evenly cast and wells are clean. Avoid disturbing the wells during loading to prevent sample mixing or uneven migration. Use Appropriate Ladder Dilution – Some DNA ladders need to be diluted before use. Follow manufacturer instructions for optimal dilution ratios. https://www.youtube.com/watch?v=15XZYyU177E