
Похожее видео
×
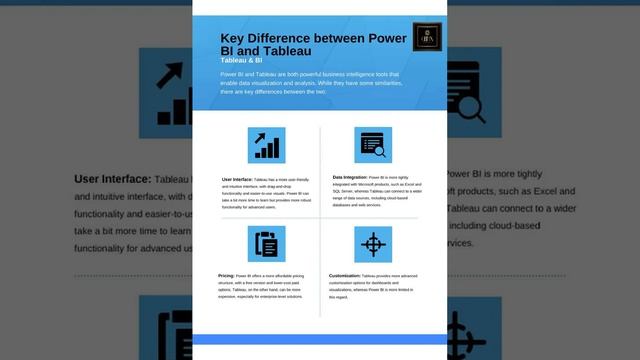
Power BI Vs Tableau
Видео: Power BI Vs Tableau
Power BI and Tableau are two of the most popular and powerful business intelligence and data visualization tools available in the market. Both tools are widely used for data analysis reporting and visualization but they have some differences in terms of features pricing and ease of use. Below Ill compare Power BI and Tableau in several key areas: 1. Ease of Use: Power BI: Power BI is known for its user-friendly interface and ease of use. It is often considered more approachable for users who are new to data visualization and analytics. Users can quickly create reports and dashboards using drag-and-drop functionality. Tableau: Tableau offers a wide range of features and customization options which can make it a bit steeper in terms of the learning curve for beginners. However it provides greater flexibility and control for advanced users. 2. Data Connectivity: Power BI: Power BI supports a variety of data connectors and offers seamless integration with Microsoft products including Excel Azure and SQL Server. It also connects to non-Microsoft data sources like Google Analytics Salesforce and more. Tableau: Tableau has an extensive list of connectors and supports a wide range of data sources both on-premises and in the cloud. It also has the capability to connect to web data sources. 3. Visualization Capabilities: Power BI: Power BI offers a robust set of visualization options including charts graphs maps and custom visuals from the Power BI marketplace. It provides a wide range of formatting and customization features for creating interactive reports and dashboards. Tableau: Tableau is renowned for its advanced visualization capabilities. It offers a wide array of visualization types including unique options like Tableau Story for interactive storytelling. Tableau also allows more granular control over formatting and customization. 4. Pricing: Power BI: Power BI offers both a free version Power BI Desktop and paid plans. The paid plans are generally considered cost-effective and provide additional features. Power BI Pro and Power BI Premium are available as paid options. Tableau: Tableaus pricing tends to be higher compared to Power BI. It offers a free public version Tableau Public for sharing public data visualizations and Tableau Desktop and Tableau ServerTableau Online are the paid options. Pricing varies based on user types and deployment options. 5. Mobile Accessibility: Power BI: Power BI provides mobile apps for iOS and Android devices enabling users to access and interact with reports and dashboards on the go. Mobile responsiveness is a key strength. Tableau: Tableau also offers mobile apps for iOS and Android devices allowing users to access and explore data visualizations on mobile devices. Mobile support is robust. 6. Community and Support: Both Power BI and Tableau have active user communities extensive documentation and online resources. Power BI benefits from its integration with the Microsoft ecosystem while Tableau has a dedicated user community known for sharing insights and best practices. 7. Integration: Power BI: Integrates seamlessly with other Microsoft tools and services making it a strong choice for organizations already using Microsoft technologies. Tableau: Offers integrations with various third-party tools and services providing flexibility in connecting to data sources and extending functionality. Ultimately the choice between Power BI and Tableau depends on your specific needs existing technology stack budget and user preferences. Both tools are capable of delivering powerful data visualization and analytics solutions and the decision should be based on your organizations unique requirements.,